Research / event reports
IMPACT OF COVID- 19: Sectoral Heat Map
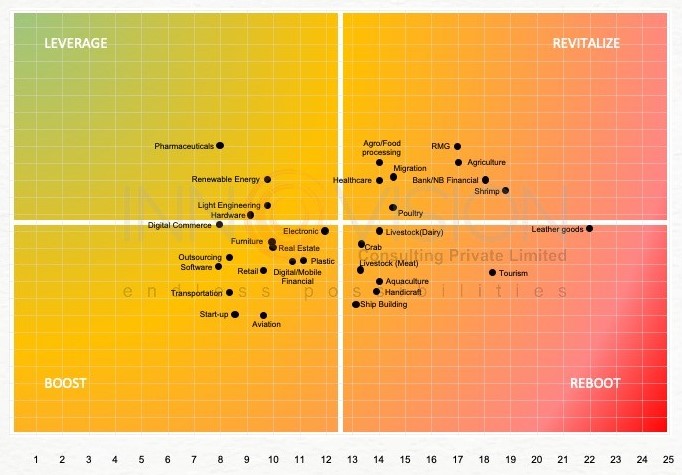
As the countries open their economies and the government’s push for recovery, there is a need for a framework to assess the impact of COVID 19 against the support pledged or provided. We at Innovision worked on developing a framework to understand the comparative impact of COVID 19 on the different sectors and we took a market systems perspective to design the framework.
We used secondary literature/ published reports to assess the socio-economic impact of COVID 19 against five indicators – disruption in (i) demand (ii) employment (iii) backward chain (iv) forward chain and (v) support systems. We then reviewed the adequacy, effectiveness and inclusiveness of the COVID 19 impact mitigation measures against five indicators (i) government support (ii) engagement of trade bodies (iii) pledged support from development partners (iv) current/ ongoing support from development partners and (v) inclusivity of the measures.
The impact was plotted on a scale of 1-5 with 1 being low and 5 being high. While the support was plotted on a scale of 1-5 with 1 being low and 5 being high. As the sectors are different with respect to their dynamics (Structure, value, coverage etc.) we assigned a complexity score to the sectors. For example, for the COVID 19 Economic Heat Map in Bangladesh, we assigned Ready Made Garment (RMG) sector the highest complexity score of 1 and in comparison, to it aquaculture was given a complexity score of 0.7. The complexity adjusted aggregate score was then used to plot the sectors into four zones – leverage (high support, low impact), boost (low support, low impact), reboot (low support, high impact, and revitalize (high support, high impact). The results presented here can vary depending on the interpretation of the complexity of the sectors and the evaluation of impact and support.
Download the document for details
You may want to read
